IBM MQ and Statistics – Introduction
So Yes – IBM MQ has had the possibility to produce statistics for some time. With IBM MQ v9 this ability has improved. It is now possible for applications, interested in processing monitoring information – or even for IBM MQ itself – to connect and receive statistics updates with no more configuration than proper authorization. The current supplied set of statistics (IBM MQ CD 9.0.4) can range from the amount of CPU used by a specific queue manager to how many messages that have been put on a specific queue over a period of time. Using the MQ v9 statistics monitoring framework it is also possible to add instrumentation to user applications – applications that might not even be MQ related at all.
The IBM Documentation (before April 1st 2021 IBM Knowledge Center) addresses certain areas and there are articles that try to focus more on aspects such as differences between v9 and pre-v9 functionality as well as providing coding examples and opening up for new ideas. I will address some of the – IMHO – most usable sources further down in this blog entry.
I will also make an attempt to expand a bit on what is not necessarily generally documented and how the retrieved information possibly can be used. In some instances there also seems to be a lack of correct or definitive answers – and those instances can benefit from a level of discussion as well.
Since Statistics information is such a vital part within IBM Integration – not only for IBM MQ, but also for products like IBM App Connect Enterprise (formerly known as WebSphere Message Broker and IBM Integration Bus) new statistics areas and options are added regularly – and I will try to keep up to date.
The command window output shown in this entry, illustrating received monitoring events, is based upon an IBM MQ JMS PCF application created for the purpose of illustration and verification.
Administrative/Monitoring information as Messages
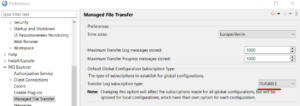
IBM Integration in general has found the publishing of administrative/monitoring events as messages – particularly using publish subscribe – as a useful means of managing events: IBM App Connect Enterprise makes use of the Message Broker at hand for monitoring data: its’ Mosquitto (yes the spelling is correct) MQTT broker is used if the Integration Node has not been associated with an IBM MQ queue manager and IBM MQ File Transfer uses topics to communicate its status. If we for example want to know more about when an agent comes up or goes down, it would be reasonable to subscribe to the
![]() -Topic.
-Topic.
This is what the IBM MQ explorer does to verify the Managed File Transfer Agent status. For MQ Explorer there is also an option to allow for the reception of status messages, even though MQ Explorer itself might be down. This is performed using durable subscriptions. This concept is addressed more in detail below.
We can of course subscribe to this topic ourselves and thus be notified of changes in MFT agent statuses. Further – if we just create an IBM MQ API-subscriber (as opposed to an administrative subscriber), using the JMS session.createSubscriber() we would be given a non-durable subscriber – that is it exists only as long as the application is running.
It is still possible however to go into IBM MQ Explorer (or runmqsc) and define an administrative subscriber, in which case the subscriber will become durable. In this case it is necessary to connect it to an MQ queue (an existing queue for managed subscriptions) and by doing so one would also receive agent status history – that is each status message would result in an incoming message. This can be done for audit purposes – or to verify SLA requirements – or just to verify the functionality.
There are a number of characteristics that separate topics (publish/subscribe) from normal queue (point to point) operations.. Three of the most important differences are:
-
- They are non intrusive. That is, if an application puts a message on a topic and an application (consumer, subscriber) wants to have a copy, it would just subscribe to the topic. The producing application does not need to know who is listening or to whom the messages will be delivered. Traditionally topics have been used for auditing purposes: without interfering in the integration logic, it is possible to just add a new subscriber (durable or not durable). This could for example be a logging functionality, performing archival of incoming messages. This can be achieved while the main integration flow is still progressing – without any interruptions.
In IBM MQ 9.2.3 the possibility to add a way of creating a copy of an MQ Message – and forward it to another queue for further (possibly audit) processing – has been introduced. It is called Streaming Queues, but instead of allowing the application to decide what topics they want to subscribe to, the Streaming Queues functionality relies on an administrative action – where specific queue attributes need to be explicitly altered in order configure this functionality. - If there are no subscribers, nobody will receive the message. If 50.000 messages are put on a topic and there is no subscriber, the 50.000 messages are lost. If the messages had been put on a queue, all messages would still be there.
- Topics traditionally don’t scale well. Typically a way to scale out processing of huge amounts of data is to add more consumers to a queue. Each consumer would read a message – and when doing so the message is removed. It is a destructive read. This cannot be done with JMS 1.1-based publish/subscribe: each consumer will receive its own copy and there will be no scaling performed. In JMS 2.0 a new functionality known as shared subscription was introduced.
This concept allows for multiple threads and processes to share a subscription to the same topic thus allowing a degree of publish-subscribe scalability. It is important however to realize, that all consumers must explicitly be coded (createSharedDurableConsumer) to make use of this functionality. This means that it cannot be applied to already existing consumer applications. Current non-shared subscriptions (like for example the aforementioned file logger example) would however still work as before. - Should a durable subscriber be used (intentionally or unintentionally) it’d better reconnect regularly – or be designed to run continuously. Should a durable subscriber register and never come back again (using the same client ID), memory (and/or persistent storage) might fill up sooner or later. Sooner if the producer generates a lot of messages. If an uncertainty regarding durability exists – for example if an administrative department is allowed to add an arbitrary number of subscribers with different characteristics, it might be a good idea for the message producer to set a Time To live for messages where applicable.
IBM MQ makes it easy to create durable subscribers without coding – as mentioned in the aforementioned FTE-example – where it is possible to a) create an MQ local queue, b) create a subscription to the “System.FTE/Agents/#” – topic – using any arbitrary method, but where MQ Explorer typically could be most convenient. No coding is done, but one would immediately start receiving Agent status messages. It is easy to forget that this is actually a durable subscription until the system starts issuing Queue Depth High events.
- They are non intrusive. That is, if an application puts a message on a topic and an application (consumer, subscriber) wants to have a copy, it would just subscribe to the topic. The producing application does not need to know who is listening or to whom the messages will be delivered. Traditionally topics have been used for auditing purposes: without interfering in the integration logic, it is possible to just add a new subscriber (durable or not durable). This could for example be a logging functionality, performing archival of incoming messages. This can be achieved while the main integration flow is still progressing – without any interruptions.
IBM MQ and MQ Statistics in General
A fair amount of information about how IBM MQ (version 9) generates its system topic subscriptions has been documented/addressed separately. Some of the best sources are:
- Mark Taylor has added to the topic – by putting a well-documented program – MQMonitor.java – on github. This article actually specifies how to create a system that can be monitored in the same way IBM MQ v9 manages its monitoring.
Mark has also – on github documented how IBM MQ Statistics can be monitored using Promotheus and Grafana. The relevant github projects can be found at https://github.com/ibm-messaging/mq-metric-samples and https://github.com/ibm-messaging/mq-golang as described in this article: https://community.ibm.com/community/user/integration/viewdocument/using-prometheus-and-grafana-to-mon?CommunityKey=183ec850-4947-49c8-9a2e-8e7c7fc46c64&tab=librarydocuments.
- Mark Bluemel has added a fair amount of information on how Java can be used to parse and interpret the MQ output and his own observations on the parameters associated with the received PCF messages.
An interesting point is that there does not seem to exist a public specification on exactly what the status messages look like, how the initial interval is used and what each parameter represents. Both articles including the MQMonitor source code refer to the sample program AMQSRUAA as a source for both how messages should be interpreted, but also as a “correct answer” on how to add monitoring instrumentation to user specific applications. The source code itself actually specifies:

In other words – taken into consideration that it considers itself as “primary documentation”, changes in the program also infers changes in how statistics can be used. From IBM MQ 9.0.2 a new option was added to amqsruaa allowing it to retrieve monitoring statistics from other topic strings than the default $SYS/MQ. The Salesforce Bridge started reporting statistics on topic $SYS/Application/runmqsfb and Mark Taylor´s example on how to build a sample monitoring application – following the rules of the IBM MQ statistics convention and thus also manageable by amqsruaa – takes advantage of this new –p parameter where $SYS/Application is the new starting point in the topic tree.
IBM MQ and MQ Statistics More Specific
There are some fundamentals about how IBM MQ system topic statistics work:
- In order to receive messages, no queue manager attributes need to be altered, which however was the case for pre-v9 IBM MQ monitoring. What is required is an application subscribing to the relevant topic string – for example $SYS/MQ/INFO/QMGR/qm1/Monitor/CPU/SystemSummary. It does not need to be a user application – it is perfectly possible to do a similar exercise as suggested in the SYSTEM.FTE/Agents/# example above. In this case an MQ queue would typically receive a new monitoring message every tenth second.
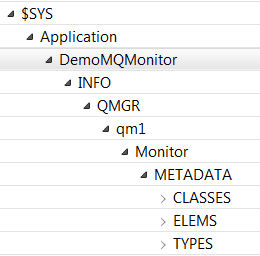
- IBM MQ advertises the Classes, Types and statistics it is possible to subscribe to. The aforementioned program amqsruaa does not have any hardcoded or parameterized property file. It listens to the Metadatatopics information published on the Meta topics. When creating statistics instrumentation for user applications a part of what needs to be done is to publish information to the Metadata topics. The results are visible in the topic status tree. The tree below is from running Mark Taylor’s MQMonitor application from github.
- The interval used once the monitoring starts is still a bit interesting. Mark Whitlock wrote a blog entry (now it seems to have disappeared), which addresses a part of it – referring to the STATQ-class. In this case the first interval received would address the time since the queue manager was started.
If a second STATQ instance was started – monitoring for example GET – it would just receive an initial interval reflecting the time since the last message was sent to the first instance. It is just the first STATQ subscriber (starting more than ten seconds after the last subscriber was closed), which will receive the full STATQ interval. It makes sense to cover the time since the queue manager was started for GET/PUT statistics.
It facilitates the retrieval of valuable information, even though it does not allow for separation of API activity into peak/non-peak hours. Then again, typically this kind of monitoring would go on for quite some time and by separately retrieving messages arriving every tenth second (typically) peak information is indeed available.Resource information – like CPU does not work like the API information. I have seen starting intervals ranging between 3 and 120 seconds – and these values have nothing to do with how long the queue manager has been running. In a sense this also makes sense, since CPU/DISK resources – even if they are allocated by a local or remote queue manager – is not really up to IBM MQ to maintain a history of. In addition these statistics are probably more accurately acquired from standard operating system monitoring tools.
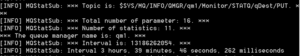
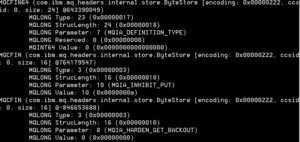
- The statistics do not arrive a sequential order. If a subscribing application has determined via the Metadata topics what statistics a specific type maintains, it will find that the statistics are numbered:
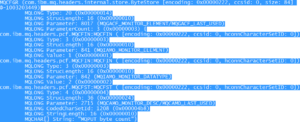
In this case the parameter from the $SYS/MQ/INFO/QMGR/qm1/Monitor/METADATA/STATQ/PUT topic represents sequence number 1, which is the second group parameter, since it starts with 0.Once the actual statistics are received, they will also have a sequence number and – again – these sequence numbers will most probably not be in order. When looking at an example from topic $SYS/MQ/INFO/QMGR/qm1/Monitor/STATQ/qDest/PUT (where qDest is the name of the queue used) we see parameters 7, 10 and 8 arrive. These need to be matched to the MQIAMO_MONITOR_ELEMENT in the previous metadata example:
IBM MQ and MQ Statistics and Some Finishing Words
The MQ Statistics, as introduced in MQv9, does not only allow IBM MQ to publish statistics about itself. It also provides an interface, which makes it possible to add more statistics and information should it be required. Of course it also allows for the removal of statistics from version to version. The current design also makes it possible – in a supported way – to add statistics instrumentation for user applications. Examples of applications already making use of these statistics include the new MQ Console (new with CD 9.0.1) and the mq-golang package on github, showing how MQ Statistics can be retrieved using the GO-language.
An important KPI in organizations could be the amount of messages making use of IBM MQ Series. This value can be used not only for resource planning – perhaps the amount of messages are constantly increasing and performance is going down – but also for internal chargeback, where specific departments need to pay depending on how much they use the messaging infrastructure. In some instances these kinds of statistics might also assist in identifying integration flows that are not currently used at all and thus can be decommissioned. Since it is possible to address statistics (STATQ) on a queue level, it might even fit into an organization – perhaps with an Integration Competence Center or Center of excellence – where different departments are given certain queue managers and queue to work with, but where it is very difficult to find out exactly how much they are used and thus to acquire a holistic view on how Messaging is used within an enterprise.
Many users would typically make certain that the producing application create count statistics referring to how many messages it sends for accounting/resource usage purposes. This can perhaps be done by log entries or even to create an end-end scenario with metadata, which is separately sent to a remote queue manager. IBM MQ Statistics can alleviate these efforts. MQ statistics have a light performance impact at the expense of not being absolutely 100% accurate and one must make a decision as of whether it is “good enough”.
If an organization has not worked with PCF-messages there might be a learning curve, but since PCF is very powerful and can be used alongside calling runmqsc scripts or REST-APIs for automating MQ operations this could be a worthwhile exercise for an organization regardless.
For statistics the amqsruaa program currently works as a primary source of documentation and if user programs should use this framework to add monitoring instrumentation, compliance to how instrumentation is actually performed can be done using amqsruaa.
One should not pay too much heed to the initial interval value unless one knows exactly how this functionality is used and has ascertained that the way the queue manager manages this fits the purpose. Typically the benefits of monitoring events increase over a certain amount of time. If it is possible within an organization that programs receiving statistics might go down without a level of HA, it could be beneficial to either create a durable subscription or possibly to create – using an administrative interface – a durable subscription pointing at a provided queue. Using this approach a certain level of flexibility can be achieved – for example by naming the queues according to standard naming conventions and also to add them to Event Monitoring policies, since one would have control over the naming.